Topics Discussed:
- Introduction to Observability
- Importance of observability in modern software systems
- Benefits of using Ebpf for observability
- Real-world examples of using Ebpf and observability tools to troubleshoot and optimize systems
1.What is observability?
In IT and cloud computing, observability is the ability to measure a system’s current state based on the data it generates
2.What are the 3 pillars of observability?
Logs: Logs are chronological records of events and actions taken by a system or application. They provide a way to understand what has happened in the past, and can be used to diagnose issues and identify patterns of behavior.
Metrics: Metrics are numerical measurements that provide information about the performance and behavior of a system or application over time. They can be used to track trends, identify anomalies, and trigger alerts based on predefined thresholds.
Traces: Traces are detailed records of a specific request or transaction as it moves through a system or application. They provide insight into the flow of data and dependencies between different components, helping to identify bottlenecks and performance issues.
3.What is ebpf?
eBPF is a more recent mechanism for writing code to be executed in the Linux kernel space that has already been used to create programs for networking, debugging, tracing, firewalls, and more.
4.What are the different uses of ebpf?
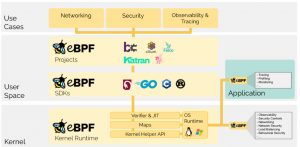
Network security: eBPF can be used to implement security policies and detect potential threats in real-time. It can also be used for network forensics and incident response.
Performance monitoring: eBPF allows for the efficient monitoring of system performance, including CPU usage, disk I/O, and memory usage. It can be used to identify bottlenecks and improve system performance.
Tracing: eBPF can be used to trace system calls and kernel events, making it useful for debugging and diagnosing issues in production environments.
Load balancing: eBPF can be used to implement load balancing for network traffic, improving the availability and performance of services.
5.What is open telemetry?
Open Telemetry is an observability framework for -software and tools that assist in generating and capturing telemetry data from cloud native software.
6.Will ebpf replace open telemetry?
No.Open telemetry won’t be replacing ebpf but it will be having use case both complimenting and combined together.
7.What is Pixie?
Pixie instantly troubleshoots your application on Kubernetes without agent for specific programing languages. Pixie can help identifying traffic inside cluster and monitor in realtime
8.What is Coroot?
Coroot helps you fix service outages and even prevent them.It continously audits telemetry data to highlight issues and weak spots in your infrastructure.
Useful links